Social Media Usage Statistics For 2026: Growth And Trends

Social media isn’t slowing down. Every day, millions of people log in, scroll, like, share, and shop.
If you want to grow your brand, you need to understand where users are, how they behave, and what’s trending. That’s why we’re breaking down the social media usage statistics you need to know.
We break down the numbers, show the patterns, and reveal what they mean for your strategy so you can make smarter decisions and stay ahead of the curve.
How many social media users are there?
According to the latest data, there are 5.24 billion social media users globally.
It’s worth noting, however, that that staggering figure refers to social media user accounts rather than unique individuals. As such, the actual number of people using social media may be slightly lower, but the margin of error is estimated to be just 1-2%.
Which country has the most social media users?
China is the country with the largest number of social media users in the world—over a billion accounts are registered in the country.
Top 5 countries by number of social media users
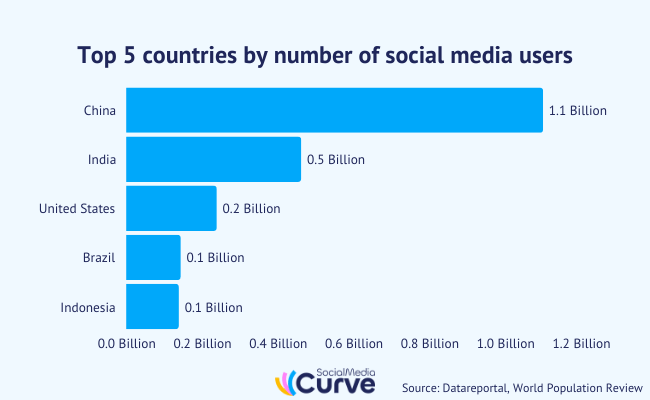
| Country | Social Media Users |
| China | 1.1 billion |
| India | 462 million |
| United States | 239 million |
| Brazil | 144 million |
| Indonesia | 139 million |
Which country has the fewest social media users?
Tokelau is the country with the fewest social media users in the world, with just 100 registered accounts.
Bottom 5 countries by number of social media users

| Country | Social Media Users |
| Tokelau | 100 |
| Niue | 1,400 |
| Falkland Islands | 2,600 |
| Montserrat | 2,700 |
| Wallis and Futuna | 4,800 |
How many social media platforms do people use?
The average number of social media platforms used by each person globally is 6.8. That’s up by +2.3% year-over-year.
Note also that the average number of social media networks used varies by region. For instance, it’s substantially more in the UAE (8.62) and less in Japan (3.49).
Sources: Datareportal, World Population Review
What percentage of the population uses social media?
As of this year, approximately 63.9% of the global population uses social media, which equates to 5.24 billion of the 8.2 billion people worldwide.

What’s more:
- 94.2% of the world’s online population (people with access to the internet) use social media
- 86.6% of the world’s adult population (18+) use social media
- 73% of the United States population uses social media
What percentage of businesses use social media?
There are no available statistics on the percentage of global businesses that use social media, but regional data suggests it’s the majority.
In the EU:
- 60.9% of businesses use at least one type of social media as of 2023 (up from 36.8% in 2015).
- Larger enterprises lead the way, with 86% of them using social media, compared to 58% of small businesses.
- 29.5% use only 1 type of social media, 23.3% use 2 types, and 8.1% use 3 types
In the United States:
- 90% of surveyed small business owners utilize social media for marketing
- 74% consider social media to be a valuable tool for business
Social media penetration rate by region
Social media penetration varies widely by region, with some areas seeing nearly universal use, while others still have relatively low engagement.
Regions like Northern Europe, Western Europe, and Eastern Asia boast the highest penetration rates (with over 75% of their populations using social media), while regions in Africa and South Asia lag behind.
Social media penetration rate by region (as a % of total population)
| Region | Penetration Rate (%) |
| North America | 73.7% |
| Central America | 66.6% |
| Southern America | 67.7% |
| Caribbean | 51.3% |
| Northern Europe | 78.7% |
| Western Europe | 77.1% |
| Southern Europe | 74.2% |
| Eastern Europe | 70.5% |
| Northern Africa | 41.9% |
| Western Africa | 16.6% |
| Middle Africa | 10.1% |
| Eastern Africa | 11.1% |
| Southern Africa | 40.5% |
| Central Asia | 39.3% |
| Western Asia | 64.6% |
| Southern Asia | 33.4% |
| Eastern Asia | 76% |
| South-Eastern Asia | 61.5% |
| Oceania | 60.5% |
Which country has the highest social media penetration rate?
The UAE has the highest social media penetration rate in the world, with more user accounts than people (likely due to duplicate accounts), reflecting a penetration rate of 100.3%.
Other countries with exceptionally high penetration rates include Saudi Arabia, South Korea, and Singapore, all boasting penetration rates above 80%.
Countries with the highest social media penetration rates

| Country | Penetration Rate (%) |
| UAE | 100.3% |
| Saudi Arabia | 99.6% |
| South Korea | 94.7% |
| Singapore | 88.2% |
| Kuwait | 85.6% |
Which country has the lowest social media penetration rate?
North Korea has the lowest social media penetration rate in the world, with close to 0% of the population using social media. This should come as no surprise, given that the North Korean government blocks its citizens from accessing the internet.
Other countries with minimal social media usage include developing nations like Eritrea, Niger, and Turkmenistan, all of which have penetration rates well below 5%.
Countries with the lowest social media penetration rates

| Country | Penetration Rate (%) |
| North Korea | 0% |
| Eritrea | 0.4% |
| Niger | 2.4% |
| Turkmenistan | 3.2% |
Sources: Datareportal, Eurostat, SocialMediaToday
How quickly are social media user numbers growing?
Social media usage has increased dramatically over the last two decades, but its year-over-year growth rate has slowed down somewhat over the last few years.
The total number of social media users globally grew by 206 million over the last year (+4.1%), which equates to around 6.5 new users every second. In the first quarter of 2025, they grew by a further 24 million (+0.5%).
Number of social media users by year
The table below shows the growth in social media user numbers over time.
As you can see, users have steadily increased over the past decade, with significant jumps in earlier years. The growth rate has slowed somewhat since 2023, but social media continues to expand, albeit at a more modest pace.
Number of social media users by year (and year-over-year growth rate)

| Year | Number of Users | Year-over-Year Growth (%) |
| 2015 | 2.08 billion | – |
| 2016 | 2.31 billion | +11% |
| 2017 | 2.79 billion | +21% |
| 2018 | 3.20 billion | +15% |
| 2019 | 3.46 billion | +8.3% |
| 2020 | 3.71 billion | +7.2% |
| 2021 | 4.20 billion | +13% |
| 2022 | 4.62 billion | +10% |
| 2023 | 4.76 billion | +3% |
| 2024 | 5.04 billion | +5.8% |
| 2025 | 5.24 billion | +4.1% |
Social media global penetration rate by year
The table below shows the growth in the global social media penetration rate over time. Penetration rate is the number of social media users as a percentage of the global population.
The two biggest increases in social media penetration over the last decade came between 2016 and 2017, and 2020 and 2021 (during the pandemic). In both cases, the increase was close to +6%.

| Year | Penetration Rate (%) |
| 2015 | 28% |
| 2016 | 30.7% |
| 2017 | 36.7% |
| 2018 | 41.6% |
| 2019 | 44.5% |
| 2020 | 47.2% |
| 2021 | 53% |
| 2022 | 57.9% |
| 2023 | 59.1% |
| 2024 | 62% |
| 2025 | 63.9% |
Source: Datareportal
How long do people spend on social media?
Last year, the average person spent 2 hours and 21 minutes on social media each day, showing a slight decrease of 1.3% year-over-year. That’s over a third of the total time spent on the internet daily (6 hours and 38 minutes).
Interestingly, people still spend more time watching TV (3 hours and 13 minutes) than they spend using social media.
Daily time spent on social media by year
Interestingly, the average daily time spent using social media has decreased slightly over the last few years, dropping by around 10 minutes since its peak in 2022.
However, the long-term trends tell a different story, with time spent on social media up by +30 minutes per day compared to 2015
Daily time spent on social media by year (in hours: minutes)
| Year | Time Spent | Increase / Decrease |
| 2015 | 1h 51m | – |
| 2016 | 2h 08m | +17 minutes |
| 2017 | 2h 15m | +7 minutes |
| 2018 | 2h 22m | +7 minutes |
| 2019 | 2h 25m | +3 minutes |
| 2020 | 2h 25m | 0 minutes |
| 2021 | 2h 27m | +2 minutes |
| 2022 | 2h 31m | +4 minutes |
| 2023 | 2h 23m | -8 minutes |
| 2024 | 2h 21m | -2 minutes |
Average daily time spent on social media by age and gender
Time spent on social media varies across age groups and genders. Younger age groups tend to spend more time on social platforms, with women generally spending more time than men across all age categories.
Average daily time spent on social media by age and gender (in hours: minutes):

| Age | Female (time spent) | Male (time spent) |
| 16-24 | 2h 59m | 2h 34m |
| 25-34 | 2h 50m | 2h 35m |
| 35-44 | 2h 25m | 2h 16m |
| 45-54 | 2h 07m | 1h 57m |
| 55-64 | 1h 46m | 1h 34m |
| 65+ | 0h 51m | 0h 40m |
Which country spends the most time on social media?
Kenya leads the world in social media engagement, with users in the country spending an average of 4 hours and 13 minutes per day on social platforms—more than any other country.
Other countries that have the highest daily average time spent on social media include Chile (3 hours 39 minutes) and South Africa (3 hours 36 minutes).
Which country spends the least time on social media?
On the opposite end of the spectrum, Japanese people spend the least time on social media. Users in Japan spend an average of just 46 minutes per day scrolling their feeds.
South Korea follows closely behind at 1 hour and 14 minutes, while Austria rounds out the bottom three with an average time spent per day of 1 hour and 32 minutes.
What percentage of our lives do we spend on social media?
If we assume that most people sleep for 7 to 8 hours a day, then the math shows that people spend around 14% of their working lives on social media.
What’s more, if we add all the time each person spends on social media together, we find that the world spends over 12 billion hours using social platforms every day. That’s the equivalent of 1.4 million years of human existence—a mind-boggling length of time.
What percentage of time spent using mobile apps goes to social media?
Social media apps account for 35.1% of the time people spend using mobile apps. That makes social media the top mobile app category by time spent.
It’s followed by entertainment apps (32.7%), utility and productivity apps (13.6%), mobile games (9.7%), business apps (1.6%), and shopping apps (1.5%).
Source: Datareportal
Why do people use social media?
People use social media services for a range of reasons. According to the latest social media data, the number one reason is to ‘keep in touch with family and friends’. Over half of those surveyed pointed to this when asked.
Top 5 reasons people use social media:
| Main reasons for using social media | Percentage of people surveyed |
| Keep in touch with family and friends | 50.8% |
| Fill my spare time | 39% |
| Read news stories | 34.5% |
| Find content | 30.5% |
| See what’s being talked about | 29.2% |
Usage of social media for brand research
46.1% of internet users worldwide use social media to learn more about brands, according to the latest data.
However, usage of social media for brand research varies by country/region. It’s highest in Nigeria (86.2%) and lowest in South Korea (22%). In the United States, it stands at 32.3%.
The usage of social media for brand research also varies significantly by age, with 54.3% of females aged 16-24 and 49.2% of males in the same age group using it, compared to only 14% of females and 12.4% of males aged 65 and older.
Instagram is the most used social media platform for brand research (62.3%).
Usage of social media for work-related activities
38.3% of the global population reportedly uses social media for work. Again, that varies by both region and age.
In the US, it stands at 25.4%. It’s highest in Nigeria (65.2%) and lowest in Japan (8.3%). 35-44 year olds are most likely to use social media for work activities, while those aged 65+, 55-64, and 16-24 are least likely
Source: Datareportal
Social media user demographics
Next, let’s look at some social media user statistics that tell us more about how different demographics vary in their usage of various social media platforms.
Social media usage by gender (global)
Globally, social media usage skews slightly male, with 54.6% of users identifying as male and 45.4% as female.
However, this split isn’t consistent across regions. Some areas show significant gender disparities, particularly in Southern Asia, where only 34% of users are female, and in Western and Middle Africa, where the female share is just 39%. These gaps are often influenced by broader social, economic, and cultural factors.
Social media usage by age (global)
Social media usage seems to be negatively correlated with age. Younger users are more likely to say they’d visited social networks in the past month than older users, according to a recent survey.

Percentage of internet users who said they visited a social network in the past month (by age)
| Age Group | Percentage (%) |
| 16–24 | 97.3% |
| 25–34 | 96.7% |
| 35–44 | 95.5% |
| 45–54 | 93.2% |
| 55–64 | 89.5% |
| 65+ | 74% |
Social media platform usage by gender (US)
Platform preferences seem to vary slightly between men and women in the U.S., with women generally more active on more visual, mainstream social networks—Facebook, Instagram, TikTok, and YouTube.
Conversely, men are more active on less popular, more text-based networks—Reddit, Twitter, and LinkedIn.
Usage of select social media platforms by gender in the United States
| Platform | Men | Woman |
| YouTube | 82% | 83% |
| 59% | 76% | |
| Instagam | 39% | 54% |
| TikTok | 25% | 40% |
| 31% | 29% | |
| 26% | 19% | |
| 27% | 17% |
Select social media platform usage by age (US)
Age seems to have a major influence on platform choice in the United States. Younger Americans gravitate toward TikTok and Instagram, while older adults tend to prefer Facebook and YouTube.
Usage of select social media platforms by age group in the United States
| Platform | 18-29 | 30-49 | 50-64 | 65+ |
| YouTube | 93% | 92% | 83% | 60% |
| 67% | 75% | 69% | 58% | |
| Instagam | 78% | 59% | 35% | 15% |
| TikTok | 62% | 39% | 24% | 10% |
| 32% | 40% | 31% | 12% | |
| 42% | 27% | 17% | 6% | |
| 44% | 31% | 11% | 3% |
Select social media platform usage by ethnicity (US)
There are noticeable differences in platform usage by ethnicity in the US, with Asian and Hispanic users showing higher engagement across most of the biggest social media platforms.
Usage of select social media platforms by ethnicity in the United States
| Platform | White | Black | Hispanic | Asian |
| YouTube | 81% | 82% | 86% | 93% |
| 69% | 64% | 66% | 67% | |
| Instagam | 43% | 46% | 58% | 57% |
| TikTok | 28% | 39% | 49% | 29% |
| 30% | 29% | 23% | 45% | |
| 20% | 23% | 25% | 37% |
Select social media platform usage by household income (US)
Income level is linked to platform preference, with higher earners more likely to use LinkedIn, Reddit, and Twitter, while lower-income groups skew slightly more toward other social media platforms like Facebook and TikTok.
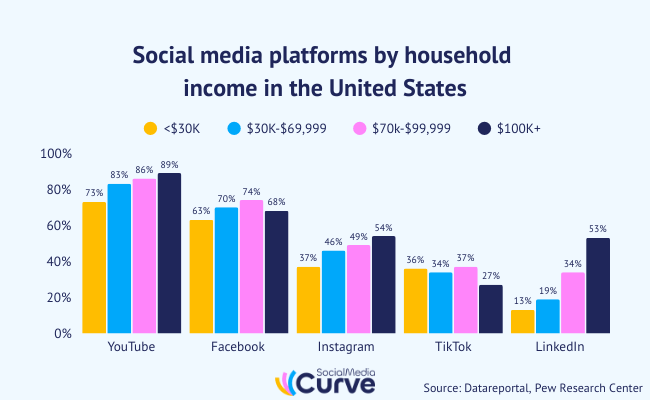
Usage of select social media platforms by household income in the United States
| Platform | <$30k | $30k-$69,999 | $70k-$99,999 | $100k+ |
| YouTube | 73% | 83% | 86% | 89% |
| 63% | 70% | 74% | 68% | |
| Instagam | 37% | 46% | 49% | 54% |
| TikTok | 36% | 34% | 37% | 27% |
| 13% | 19% | 34% | 53% | |
| 18% | 21% | 20% | 29% | |
| 12% | 23% | 22% | 30% |
Select social media platform usage by education (US)
Education appears to play a strong role in social media habits in the US, especially on platforms like LinkedIn, which is far more popular among users with a college degree. College grads are also significantly more likely to use Reddit and Twitter.
Usage of select social media platforms by education level in the United States
| Platform | High School or less | Some college | College+ |
| YouTube | 74% | 85% | 89% |
| 63% | 71% | 70% | |
| Instagam | 37% | 50% | 55% |
| TikTok | 35% | 38% | 26% |
| 10% | 28% | 53% | |
| 15% | 24% | 29% | |
| 14% | 23% | 30% |
Select social media platform usage by political lean (US)
Political affiliation also seems to affect platform choice in the U.S. Democrats are more likely to use most social media platforms, except Facebook, which is skewed Republican.
Usage of select social media platforms by political lean in the United States
| Platform | Republican | Democrat |
| YouTube | 82% | 84% |
| 70% | 67% | |
| Instagam | 43% | 53% |
| TikTok | 30% | 36% |
| 29% | 34% | |
| 20% | 26% | |
| 20% | 25% |
Source: Datareportal, Pew Research Center
What are the most used social media platforms?
YouTube and Facebook dominate the social media landscape, with more users and website visits than any other social network. Here’s a breakdown of the figures.

Top 10 social media platforms by monthly active users (MAUs)
| Platform | Users |
| 3.07 billion | |
| YouTube | 2.53 billion |
| 2 billion | |
| 2 billion | |
| TikTok | 1.59 billion |
| 1.38 billion | |
| Telegram | 950 million |
| Messenger | 947 million |
| Snapchat | 850 million |
| Douyin | 766 million |
Top 10 social media sites by traffic
| Platform | Total Visits (Monthly) | Unique Visitors (Monthly) |
| YouTube | 28.5B | 1.73B |
| 12.3B | 1.04B | |
| 5.88B | 931M | |
| 4.55B | 596M | |
| X (Twitter) | 4.44B | 448M |
| 3.5B | 642M | |
| Baidu | 2.4B | 138M |
| TikTok | 2.2B | 743M |
| 1.7B | 318M |
What social media platforms do users like the best?
Social media users prefer Instagram to any other social network, according to a recent survey.
Most popular social media platforms by user preference (% of surveyed people who said it’s their favorite)
| Platform | Favorite (% of surveyed users) |
| 16.6% | |
| 16.0% | |
| 13.1% | |
| 12.0% | |
| TikTok | 8.1% |
What social media platforms do users spend the most time on?
Users spend more time on TikTok than any other social media app (34 hours 56 minutes per month, on average).

Average time spent per user per month on social media apps
| Platform | Time Spent per Month |
| TikTok | 34h 56m |
| YouTube | 27h 10m |
| 17h 17m | |
| 16h 13m | |
| 16h 13m |
What are the most used social media platforms by marketers?
Facebook is the most used social media platform by marketers, with 86% of those surveyed reporting to have used it last year.
Most used social media platforms by marketers
| Platform | % of Marketers Using |
| 86% | |
| 79% | |
| 65% | |
| YouTube | 51% |
| X (Twitter) | 31% |
| TikTok | 28% |
| Threads | 9% |
Sources: Datareportal, Statista
Final thoughts
Social media isn’t just growing, it’s evolving every day.
The numbers and trends show where people are spending their time and what’s capturing attention. Knowing this gives you a serious edge.
Use these insights to guide your strategy, focus on the platforms that matter, and create content that actually connects. Stay informed, stay consistent, and you’ll stay ahead.
Understanding the trends isn’t optional anymore. It’s how you win.