
Iconosquare Review 2026: More Than Just A Social Media Analytics Tool


Welcome to our Iconosquare review.
It’s one of the best social media analytics tool on the market. And by the end of this post, you’ll understand why we think so.
But it does a lot more than just analytics.
If you’re looking for a way to manage your social media accounts and improve your digital marketing strategy, look no further than Iconosquare.
In this Iconosquare review, we’ll talk about what this tool is, its features, and pricing. You’ll learn just how this tool can improve your social media strategy.
What is Iconosquare?
Iconosquare started as an Instagram analytics tool but has since expanded its services to include other social networks. Now it can handle analytics and scheduling for Instagram, Facebook, Twitter, and LinkedIn (only scheduling for Twitter).
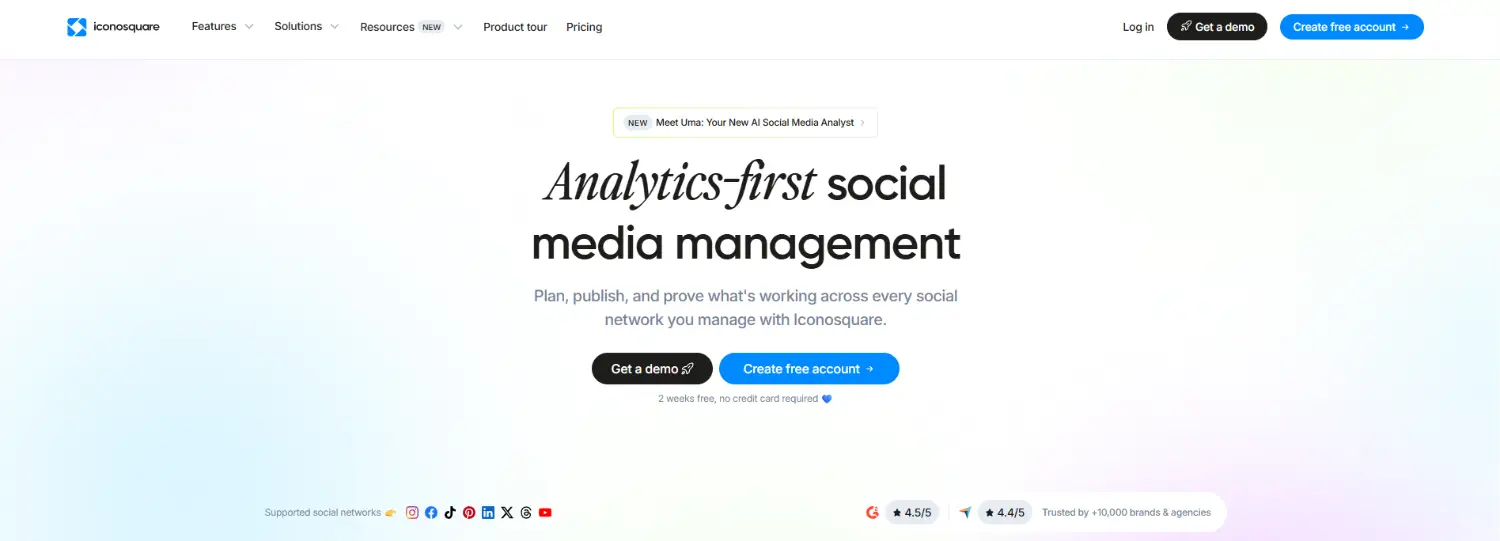
It serves many purposes but ultimately, it aims to unify all of your social media profiles so that you’re able to manage each one under one roof.
To understand how Iconosquare works, we’ll need to explore its core features and how they can help digital marketers.
Iconosquare social media scheduling
Social media scheduling allows you to publish posts immediately or sometime in the future. Auto-publishing is a great feature to have especially if you’re having trouble posting consistently. Iconosquare offers scheduling for Instagram, Facebook, and Twitter.

This also improves your team workflow thanks to its Approval feature. Higher-ups can now approve or reject social media posts that your team submits for approval. You can also choose to leave comments if necessary.
You will also find a bulk media uploader tool to store your media files in one place. Files can be categorized for easier access when you need them. You can upload images using Dropbox or OneDrive. When you use images, they are tagged as such so none in your team would make the mistake of reusing these assets.
Then there are the Instagram-specific features like Feed Preview. This allows you to see what your feed will look like before you even publish your posts. It also makes sure that all your posts follow your branding. If you’re not happy with the look, all you need to do is to rearrange the posts by dragging and dropping them where you think they’ll fit better.
Even your first comment can be scheduled in advance.
Other notable features include hashtag suggestions, saved captions, and location tagging.
Iconosquare analytics
Of course, you’ll need a way to track your social media performance to see if your target audience likes your Instagram posts or not.
Iconosquare has the tools to measure audience engagement not just for Instagram but also for Facebook, TikTok, and LinkedIn.

You’ll receive metrics like impressions, reach, average reach per post, and average reach rate by post. All of these data can help you adjust your Instagram marketing to be more optimal. The same can be said for your Facebook analytics and other social media accounts.
And for those that use Instagram Stories, you’d be happy to hear that there’s a dedicated tool for measuring its reach and impressions.
The Engagement metric is special because it details the best time for you to post which is a rare feature for social media schedulers. We’ll dive more into this in a later section.
There’s also a Community Analytics feature that tells you who your followers are, what languages they speak, and details like age and gender.
Iconosquare monitoring
If you want engaged followers, then you’ll have to commit to communicating with your audience. And one of the reasons why Iconosquare is such a great tool is because it allows you to engage Instagram users in real-time.
Monitoring also helps you keep track of tags and mentions of your brand on Instagram.

And if you want to outperform your competitors, then you can use the same feature to see what kind of content they typically post. You’ll not only be able to see their metrics, but you can also compare them to your own Instagram account or other social profiles.
Iconosquare review: exploring the user interface
Here’s what you can expect when you sign up for an Iconosquare account.
When you log in, you’ll be redirected to the My Dashboard section. Here, you’ll find a list of available dashboards that you created as well as the option to create a new one. There’s also a drop-down menu where you can select which social profile to view.

This allows you to build a custom dashboard that shows all of the important metrics you need to know at a glance. This includes average likes, reach, impressions, follower growth, and top countries. There’s plenty more too.
The sidebar is where you’ll find the other advanced features.
The Analytics tab
The Analytics section is divided into subcategories to make it easier for you to access the information you need.
Overview is where you can get a general feel for how your social media account performed during the time frame you specify.

You will also see your most recent posts and stories on Instagram. For Facebook, it’s a list of your most recent posts. Regardless of the social platform, you’ll find metrics to help you gauge a post’s effectiveness.
Engagement is where it gets interesting. Not only do you get to see how people interact with your posts, but this social media management tool also provides data as to the best time to post your content.

This is very useful since it allows you to schedule posts when they’re most likely to have the biggest impact.
Now, you’ve probably seen studies about the best time to post on social media. But all of that data is meaningless because it typically doesn’t apply to your audience. Iconosquare will help you get meaningful data that tells you the correct time to post. No guess work here.

The reports are very visual, making them easier to understand even if you have no previous experience working with social media management software.

The Community section tells you more about your audience — their age, gender, languages they speak, what country they’re from, and more.

Reach gives you additional data to help you assess how many people can see your posts as well as data on when your followers are most active.

You’ll also see which of your specific posts have the highest reach.
Profile Activity shows data like profile visits, website clicks, and other related numbers. The Stories section provides data that are specific to the Instagram Stories that you post on your account.

This includes your impressions, reach, and information on when it’s the best time to post.

All reports can be downloaded manually or scheduled. You can do weekly reports though you can also set reports to be automatically sent to you daily, monthly, or yearly.

The Content tab
The Content tab contains all of your most recent media posts and stories. You can also create an album and add posts there manually or automatically. It’s basically a hub for content management.

It’s an easy way of keeping track of your most influential posts for future reference.
The Publishing tab
The Publishing tab contains a few subcategories as well. This is where you go when you want to prepare engaging posts for your social profiles.
The Scheduler redirects you to your content calendar. It’s where you draft posts, pick time slots, and preview your work before publishing.

Unpublished posts can be reordered by dragging the images around. You can set your preferred time slots to schedule posts quicker.

If you’re working with a team or clients, you can head on over to Collaborations to adjust your sharing settings and view notifications.
You can drop files under the Media Library and store them there for future use. You can add files from your computer or upload them through Dropbox or OneDrive.
The Saved Captions and Hashtags section is where you go to add new captions and hashtags for future use.
Conversations
Y